Venn Diagrams (Three Sets)
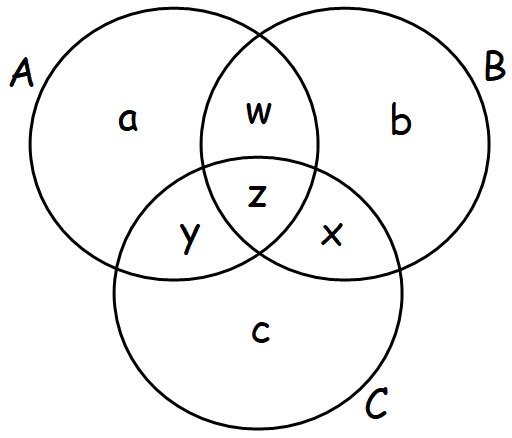
Let us consider the three sets A, B and C.
Set A contains a elements, B contains b elements and C contains c elements.
Both A and B contains w elements, B and C contains x elements, A and C contains y elements, all the three sets A, B and C contains z elements.
We can use Venn diagram with 3 circles to represent the above information as shown below.
Examples
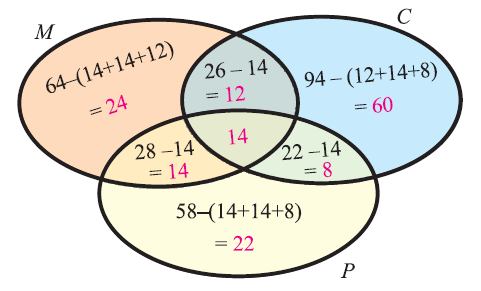
1. In a survey of university students, 64 had taken mathematics course, 94 had taken chemistry course, 58 had taken a physics course, 28 had taken mathematics and physics, 26 had taken mathematics and chemistry, 22 had taken chemistry and physics course, and 14 had taken all the three courses. Find how many had taken one course only.
Solution :
Step 1 :
Let M, C and P represent the courses Mathematics, Chemistry and Physics respectively.
Venn diagram related to the information given in the question:
Step 2 :
From the Venn diagram above, we have
No. of students who had taken only math = 24
No. of students who had taken only chemistry = 60
No. of students who had taken only physics = 22
Step 3 :
Total no. of students who had taken only one course :
= 24 + 60 + 22
= 106
So, the total number of students who had taken only one course is 106.
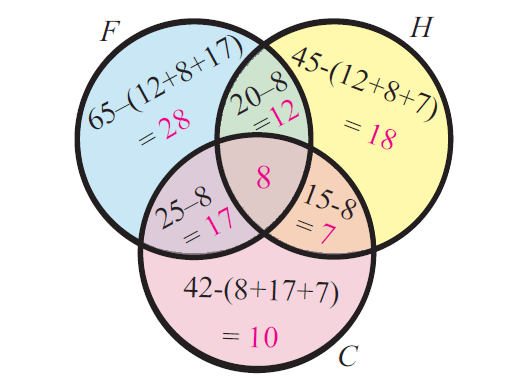
2. In a group of students, 65 play foot ball, 45 play hockey, 42 play cricket, 20 play foot ball and hockey, 25 play foot ball and cricket, 15 play hockey and cricket and 8 play all the three games. Find the total number of students in the group (Assume that each student in the group plays at least one game.)
Solution :
Step 1 :
Let F, H and C represent the games football, hockey and cricket respectively.
Venn diagram related to the information given in the question :
Step 2 :
Total number of students in the group :
= 28 + 12 + 18 + 7 + 10 + 17 + 8
= 100
So, the total number of students in the group is 100.
3. An advertising agency finds that, of its 170 clients, 115 use Television, 110 use Radio and 130 use Magazines. Also 85 use Television and Magazines, 75 use Television and Radio, 95 use Radio and Magazines, 70 use all the three. Draw Venn diagram to represent these data. Find
(i) how many use only Radio?
(ii) how many use only Television?
(iii) how many use Television and Magazine but not radio?
Solution:
Let T, R and M represent the people who use Television, Radio and Magazines respectively.
Venn diagram related to the information given in the question :
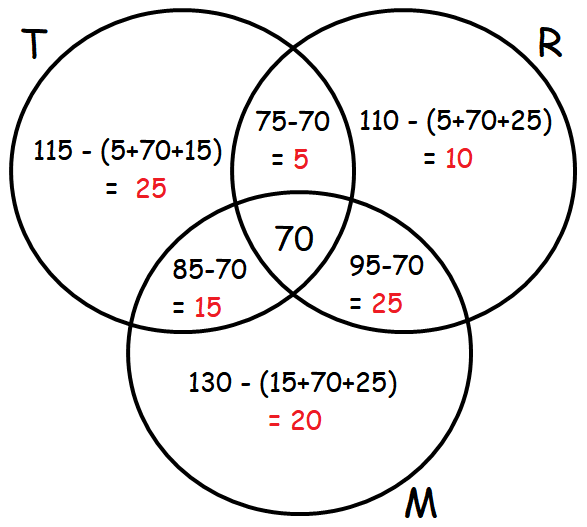
From the above Venn diagram, we have
(i) Number of people who use only Radio is 10
(ii) Number of people who use only Television is 25
(iii) Number of people who use Television and Magazine but not radio is 15.