Course Content
Chapter 01 – Sets
A set is a list of objects in no particular order; they could be numbers, letters, or even words. A Venn diagram is a way of representing sets visually.
0/9
Chapter 02 – Rational Numbers
In mathematics, a rational number is a number that can be expressed as the quotient or fraction p/q of two integers, a numerator p, and a non-zero denominator q. In this chapter, we will learn to represent rational numbers on a number line and perform arithmetic operations.
0/8
Chapter 03 – Decimals
Decimals are a set of numbers lying between integers on a number line. They are just another way to represent fractions in mathematics. In this chapter, we will learn about the conversion of decimals to rational numbers, the kinds of decimals, and absolute values.
0/8
Chapter 04 – Exponents
The exponent of a number says how many times to use that number in a multiplication. The laws of exponents simplify the multiplication and division operations and help to solve the problems easily. In this chapter, we are going to discuss the six important laws of exponents.
0/7
Chapter 05 – Square Root of Positive Numbers
Square root, in mathematics, is a factor of a number that, when multiplied by itself, gives the original number. In this chapter, we will learn about what makes perfect squares and will find the roots of positive numbers by considering real-life scenarios.
0/5
Chapter 06 – Direct and Inverse Variation
Variation means change. With direct variation, numbers change proportionately in the same direction, while with inverse variation, they change in opposite directions. In this chapter, we will earn how to solve direct and inverse variation problems, explore their definitions, and work examples to understand the equations and techniques for solving them. Also, we learn to find the continued ratio for two or more ratios.
0/9
Chapter 07 – Financial Arithmetic
Financial mathematics describes the application of mathematics and mathematical modeling to solve financial problems. In this chapter, we will learn about the concept of taxation, profit/markups, zakat & ushr, and how they relate to our daily life.
0/7
Chapter 08 – Algebraic Expressions
Algebraic expressions are the idea of expressing numbers using letters or alphabets without specifying their actual values. The algebraic equations which are valid for all values of variables in them are called algebraic identities. In this chapter, we will learn to perform operations on polynomials and to factorize an algebraic equation by using identities.
0/13
Chapter 09 – Linear Equations
Linear equations are equations having variables with power 1. ax+b = 0 is an example with one variable where x is the variable, and a and b are real numbers. In this chapter, we will learn the definition, type of solutions, and how to solve these equations with one variable and two variables using different methods along with examples.
0/13
Chapter 10 – Fundamentals of Geometry
Geometry is the study of different types of shapes, figures, and sizes in Maths or real life. In geometry, we learn about different angles, transformations, and similarities in the figures. It is important to know and understand some basic concepts. We will learn about working in different numbers of dimensions, and about some of the most fundamental concepts in geometry, including points, lines, and planes.
0/10
Chapter 11 – Practical Geometry
The practical Geometry chapter will teach you about lines and to construct two-dimensional given different kinds of measurements. A quadrilateral is a closed two-dimensional shape that has four sides and four angles. Any four-sided closed shape such as square, rectangle, rhombus, parallelogram, trapezium, etc. And a closed two-dimensional shape that has 3 sides and 3 angles is known as a triangle.
0/17
Chapter 12 – Circumference, Area and Volume
This topic comes under analytical geometry and the formulas for the volume and the surface area of the sphere were first discovered by Archimedes. In this chapter, we will learn about the area and volume of two-dimensional and three-dimensional shapes.
0/8
Chapter 13 – Information Handling
Frequency distribution, in statistics, is a graph or data set organized to show the frequency of occurrence of each possible outcome of a repeatable event observed many times. And, a pie chart is a way of representing data in a circular graph. Pie slices of the chart show the relative size of the data. In this chapter, we will learn to construct the frequency distribution table, some new pie chart vocabulary, and learn to construct the pie chart to represent the data.
0/8
Mathematics – VII
About Lesson

What is a Bar Graph?

A bar graph can be defined as a chart or a graphical representation of data, quantities or numbers using bars or strips.

Bar graphs are used to compare and contrast numbers, frequencies or other measures of distinct categories of data.

What is Bar Graph? [Definition Facts & Example]


What is a Bar Graph Used For?

A bar graph (also known as a bar chart or bar diagram) is a visual tool. A bar graph may run horizontally or vertically. The important thing to know is that the longer the bar, the greater its value. Bar graphs consist of two axes. On a vertical bar graph, as shown above, the horizontal axis (or x-axis) shows the data categories. In this example, they are years. The vertical axis (or y-axis) is the scale. The colored bars are the data series.


Bar graphs have three key attributes:

  • A bar diagram makes it easy to compare sets of data between different groups at a glance.
  • The graph represents categories on one axis and a discrete value in the other. The goal is to show the relationship between the two axes.
  • Bar charts can also show big changes in data over time.


Types of a Bar Graph

When presenting data visually, there are several different styles of bar graphs to consider.

Vertical Bar Graph

The most common type of bar graph is the vertical bar graph. It is very useful when presenting a series of data over time.

Bar Graphs

One disadvantage of vertical bar graphs is that they don’t leave much room at the bottom of the chart if long labels are required.


Horizontal Bar Graph

Converting the vertical data to a horizontal bar chart solves this problem. There is plenty of room for the long label along the vertical axis, as shown below.

Bar Graphs


How to Construct a Bar Graph?

Steps in the construction of bar graphs/column graphs:

  • On a graph, draw two lines perpendicular to each other, intersecting at 0.
  • The horizontal line is x-axis and vertical line is y-axis.
  • Along the horizontal axis, choose the uniform width of bars and uniform gap between the bars and write the names of the data items whose values are to be marked.
  • Along the vertical axis, choose a suitable scale in order to determine the heights of the bars for the given values. (Frequency is taken along y-axis).
  • Calculate the heights of the bars according to the scale chosen and draw the bars.


Examples:

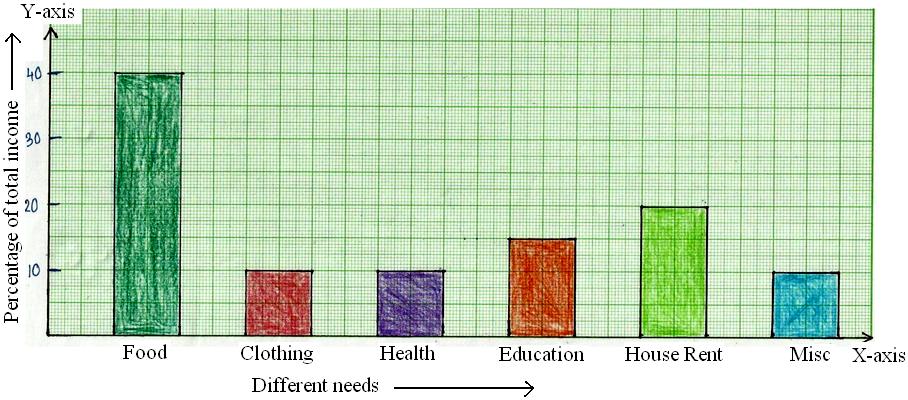
1. The percentage of total income spent under various heads by a family is given below.

Different Heads Food Clothing Health Education House Rent Miscellaneous
% Age of Total
Number
40% 10% 10% 15% 20% 5%

Represent the above data in the form of bar graph.
Examples on Construction of Bar Graphs


2. 150 students of class VI have popular school subjects as given below:

Subject French English Maths Geography Science
Number of Students 30 20 26 38 34

Draw the column graph/bar graph representing the above data.

Solution:

Take the subjects along x-axis, and the number of students along y-axis

Bar Graph Representation

The bar graph gives information of the favorite subjects of 150 students.


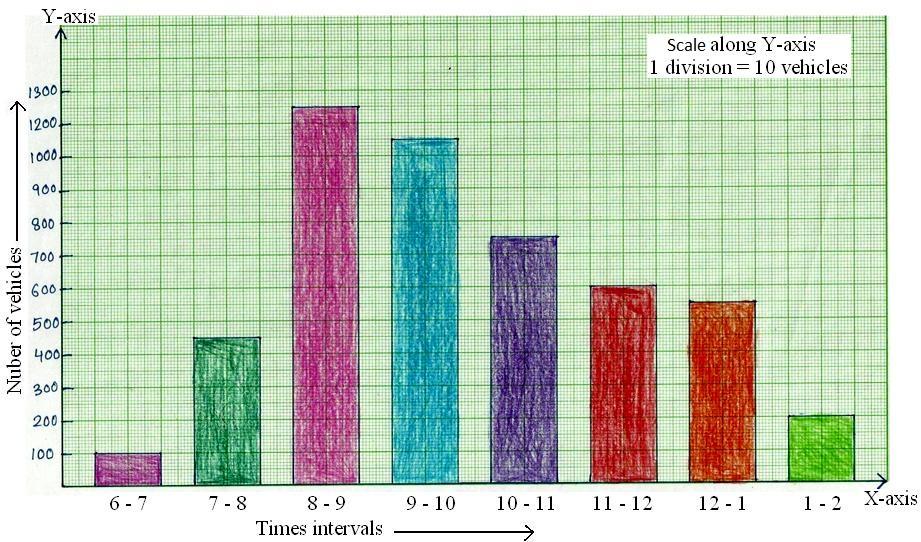
3. The vehicular traffic at a busy road crossing in a particular place was recorded on a particular day from 6 am to 2 pm and the data was rounded off to the nearest tens.

Time in Hours 6 – 7 7 – 8 8 – 9 9 – 10 10 – 11 11 – 12 12 – 1 1 – 2
Number of Vehicles 100 450 1250 1050 750 600 550 200

Bar Graph or Column Graph

The bar graph gives the information of the number of vehicles passing through the crossing during different intervals of time.

Exercise Files
Bar Graph.pdf
Size: 420.76 KB
Histogram.pdf
Size: 106.89 KB
0% Complete